Revspire blog
First vs Third-Party Intent: 7 Strategies the Top Revenue Teams Use in 2026
Compare first-party and third-party intent through separate measurement, weekly deal reviews, coaching, win-loss analysis, and feedback loops.
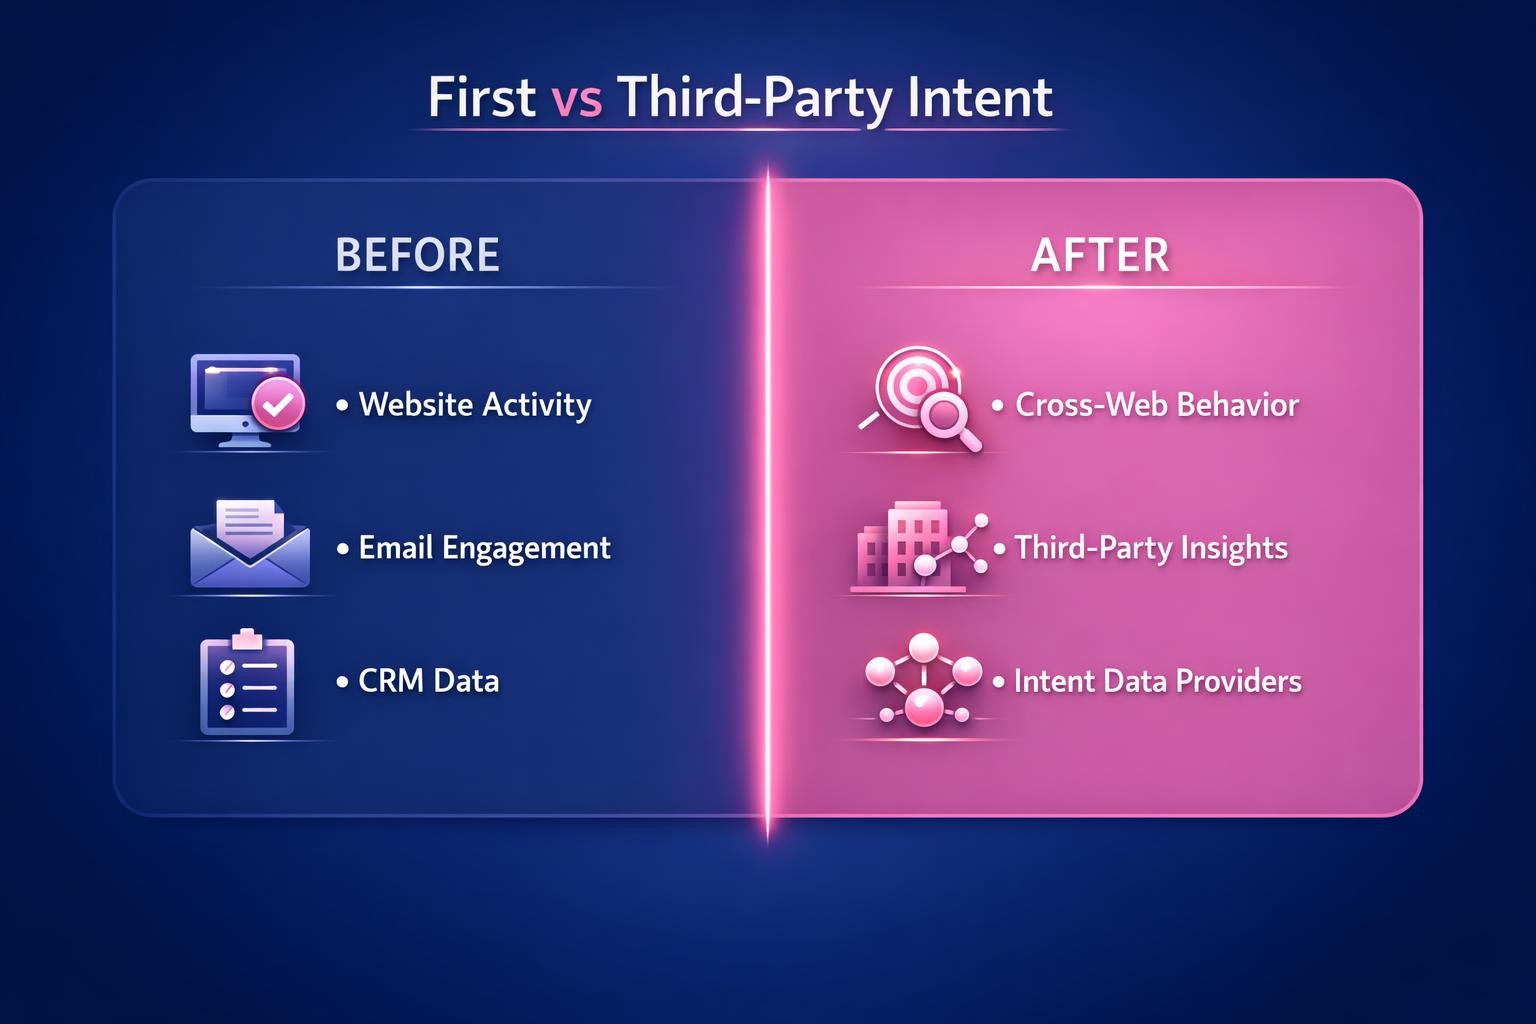
First-party intent data and third-party signals should not disappear into one undifferentiated score. A useful comparison keeps the two inputs separate, measures how each relates to deal progress, and then examines what happens when both appear in the same opportunity. The frozen source material does not specify where either category originates, so this guide does not invent a collection-based definition. It instead provides a concrete, evidence-bounded method for comparing the categories as separate, standalone, and combined inputs.
First-party vs third-party intent: the practical comparison
The central difference supported by the source material is the distinction between first-party intent data and third-party signals alone . Preserve that distinction in your operating model. Do not merge the categories before the team can measure their respective contributions.
Comparison view
What to isolate
What to evaluate
First-party intent only
Opportunities with recorded first-party intent data but no recorded third-party signal
Stage progression, time in stage, stakeholder engagement, and the next action taken
Third-party intent only
Opportunities with a recorded third-party signal but no recorded first-party intent data
The same outcome measures, plus whether the signal led to observable deal progress
Both categories
Opportunities where both categories are present
Whether the combined evidence changes prioritization, coaching, or stage progression
Neither category
Opportunities where neither category is recorded
The baseline against which the other three groups can be reviewed
This four-way comparison answers a more useful question than “Which category is always better?” It shows how each category performs in your revenue process, whether a signal stands alone, and whether the combination is associated with different outcomes. Use the same outcome measures across all four groups, but keep the groups separate in reports and reviews.
Strategies 1 through 4: Build a comparable foundation
1. Record the categories separately
Write down what excellent execution looks like at each deal stage, including how representatives record first-party intent data and third-party signals. Each record should retain its category, timing, owner, applicable opportunity, and resulting next action. A separate category field prevents one input from being mistaken for the other and makes a direct comparison possible.
Begin with an honest baseline. Pull the last six months of deal data and divide applicable opportunities into the four comparison groups above. Map each opportunity against its deal stages and identify where it advanced, stalled, or left the pipeline. Review the results by representative, segment, and deal size.
2. Compare leading and lagging indicators by category
Lagging metrics such as win rate and quota attainment describe completed outcomes. Leading indicators help the team inspect what is happening before an outcome is final. The source material identifies stakeholder engagement rates, content consumption, mutual action plan progression, and deal velocity at each stage as possible leading indicators.
Calculate those indicators separately for first-party-only, third-party-only, combined, and neither-category opportunities. Then compare them with lagging indicators such as win rates and cycle times. Measure outcomes, not activities: email, call, and task volume should not substitute for stage progression velocity, buyer engagement quality, or stakeholder coverage breadth.
Related platform: Revspire Intent Intelligence.
Keep first-party-only, third-party-only, combined, and baseline opportunities visible as separate comparison groups.
3. Review the comparison every week
Make First vs Third-Party Intent health a standing part of the weekly pipeline call. For each reviewed opportunity, identify which of the four groups applies, what evidence is recorded, and what needs to change in the next seven days. This prevents a third-party signal alone, first-party intent data alone, or a combined view from being discussed as if they were interchangeable.
Build a dashboard that shows leading and lagging indicators for every comparison group. Review it weekly and connect the findings to coaching conversations and territory reviews. When one group shows activity without progress, investigate the opportunity rather than asking for more activity.
4. Coach the difference at the deal level
Use deal-specific coaching by reviewing live opportunities with each representative, identifying where execution breaks down, and working through the fix in real time. Ask the representative to identify the recorded category, explain what changed after the signal appeared, and distinguish observed deal progress from a signal that has not yet produced progress.
The coaching goal is not to declare one category universally superior. It is to make representatives show how first-party intent data, third-party signals, or both informed an action and whether that action moved the deal.
Strategies 5 through 7: Scale the comparison
5. Add category evidence to win-loss reviews
Map every stakeholder in the buying committee, assign coverage, and track engagement with each one. Opportunities with only one active contact should be investigated rather than treated as evidence of broad stakeholder coverage.
Compare categorized signals with stakeholder coverage and observable deal progress.
Capture findings from won and lost deals through post-deal interviews, CRM data analysis, and structured win-loss reviews. For each deal, record whether first-party intent data, third-party signals, both, or neither were present; what action followed; and what outcome was observed. Feed recurring findings into playbooks, training, and strategy without turning a small number of deals into a universal rule.
6. Preserve the distinction across systems
Technology should serve the First vs Third-Party Intent process, not define it. Evaluate whether each tool preserves the category, source record, owner, timing, opportunity, and action associated with a signal. If those fields disappear when data moves, the team cannot compare the categories reliably.
Where supported, allow data to move between the CRM, engagement platform, and deal room without manual intervention. Retain the category throughout that flow so the dashboard can distinguish first-party-only, third-party-only, combined, and baseline opportunities.
7. Turn the comparison into a feedback loop
Review First vs Third-Party Intent metrics against targets each quarter, update playbooks when the team learns something new, and ask buyers for feedback about their experience. Examine each comparison group separately before changing a rule.
Retain a rule when repeated deal evidence supports it, revise it when results vary by stage or segment, and retire it when it no longer helps the team distinguish activity from progress. This creates a continuous feedback loop without assuming that either category has the same value in every deal.
Use a focused assessment to select measurable improvements for the comparison process.
A 90-day implementation plan
Use the six-month baseline to prioritize two or three improvements. Give each improvement a clear owner, a measurable goal, and a 90-day review cadence. Suitable improvements include adding a category field, separating dashboard cohorts, documenting the action taken after a signal, or adding the four-way comparison to weekly pipeline reviews.
Audit the current state, separate the comparison groups, and measure their outcomes.
Three-part explainer: Define the system, Operationalize the workflow, and Measure the impact.
- Define the system: Preserve separate first-party and third-party labels, ownership, goals, and metrics.
- Operationalize the workflow: Record what each signal prompted and reinforce the four-way comparison in weekly reviews.
- Measure the impact: Compare leading and lagging indicators across the four groups and use the findings in coaching and quarterly updates.
Put the seven strategies to work
Start by separating first-party-only, third-party-only, combined, and baseline opportunities. Establish the six-month baseline, assign ownership, compare consistent outcome measures, and bring the findings into weekly coaching and quarterly playbook reviews.