Sales Coaching Metrics: 11 KPIs with Formulas and a Worked Example
A practical perspective for connecting this idea to your revenue team’s next move.
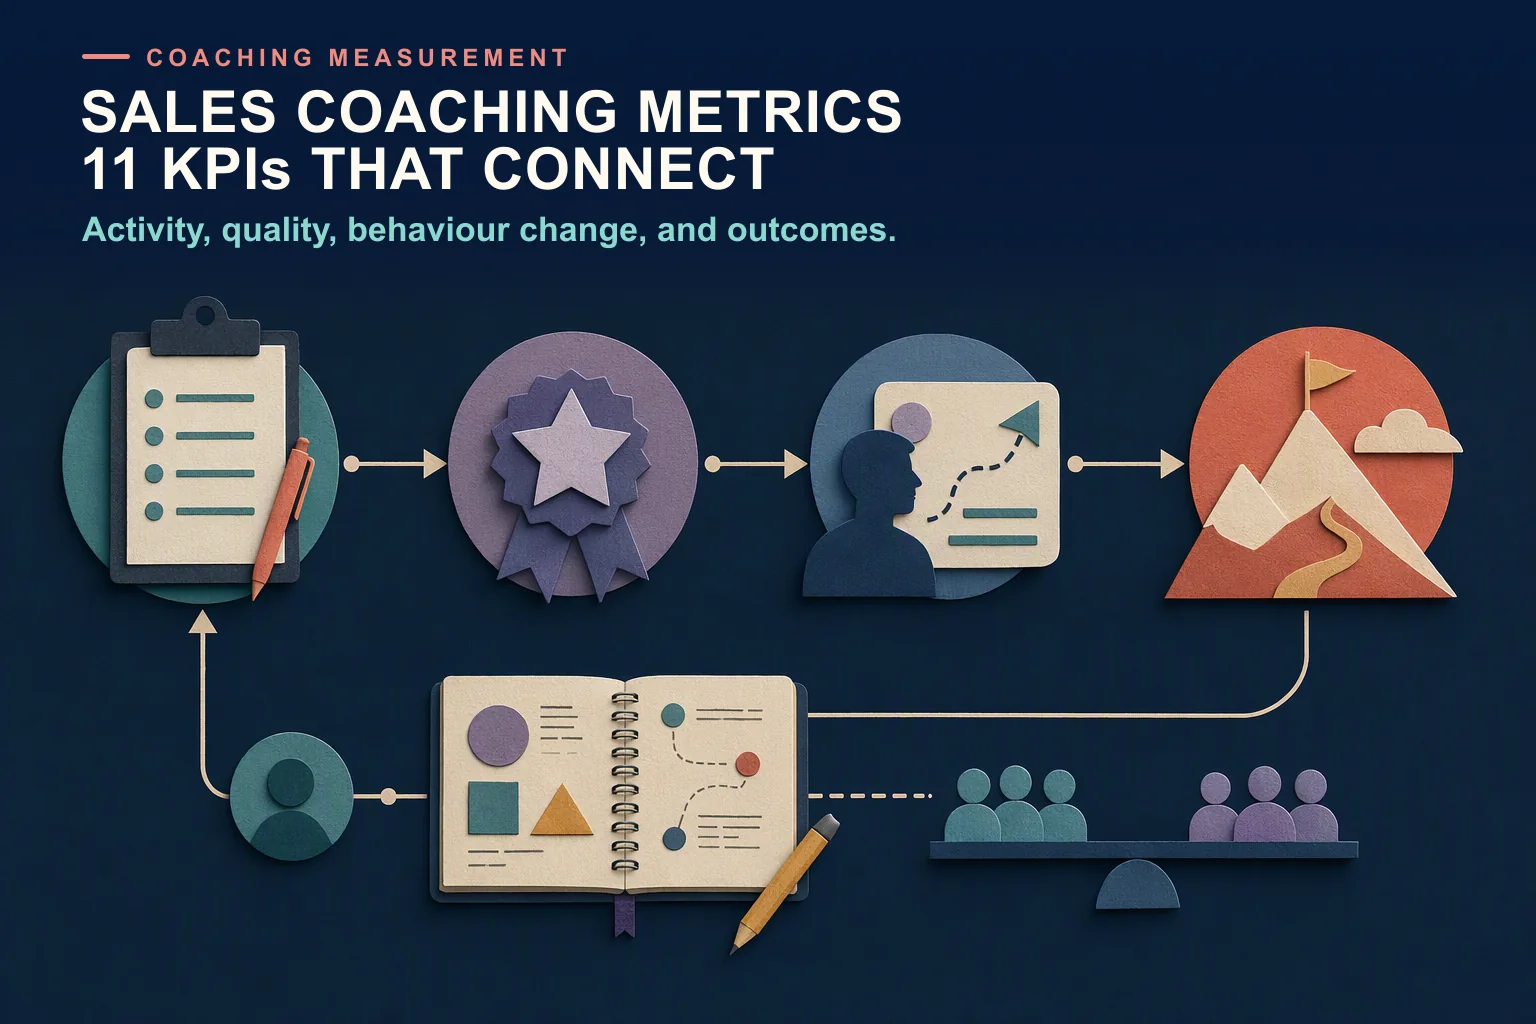
Sales coaching metrics are the measures that show whether coaching is happening, whether it is any good, whether reps change what they do on calls, and whether that change shows up in pipeline. Track them in four layers: coaching activity, coaching quality, behaviour change and outcomes. The first three are leading indicators; outcomes lag.
Below: 11 sales coaching KPIs, each with a formula, data source, review rhythm and owner, then a fictional worked example, a 30-day setup plan and common mistakes.
Last updated: 26 October 2026
What are sales coaching metrics?
A sales coaching metric tells you something about the coaching system, not just about sales results: revenue says what happened, coaching metrics say whether coaching had a chance to influence it. For the underlying definition, see the sales coaching glossary entry.
The four layers map closely onto the Kirkpatrick model as summarised by Training Industry (page last modified 16 March 2026), which Donald Kirkpatrick developed in the 1950s: reaction, learning, behaviour and results. Coaching activity is the input; rubric scores sit at the learning level; adoption on live calls is behaviour; stage conversion, win rate and ramp are results. The full training-evaluation treatment is in the Kirkpatrick and ROI guide for sales training.
Leading vs lagging sales coaching KPIs
Leading indicators move within weeks and can be acted on in the next one-to-one. Lagging indicators move over one or more sales cycles and confirm whether the leading ones mattered.
Layer
Leading or lagging
Question it answers
When it moves
Coaching activity
Leading (input)
Is coaching happening, for the right reps, on the right skill, quickly enough?
Weekly
Coaching quality
Leading
Are scores improving on the coached skill, and are managers scoring consistently?
Per coaching cycle (4 to 12 weeks)
Behaviour change
Leading (closest to outcome)
Do reps now do the coached behaviour on real calls?
2 to 8 weeks after coaching
Outcome
Lagging
Did the stage the skill affects convert better, and did deals close?
One sales cycle or more
A plain warning about outcome metrics: stage conversion, win rate and ramp time are correlational unless you compare coached reps with a similar group that was not coached on that skill in the same period. Territory changes, pricing, seasonality and rep selection all move these numbers. Without a comparison group, report them as “moved alongside coaching”, not “caused by coaching”.
Sales coaching KPI dictionary: metrics, formulas and owners
Each table lists the metric, what it measures, the formula, where the data comes from, how often to review it and who typically owns it. “Coached skill” means the one skill a coaching cycle targets, for example quantifying business impact in discovery. Scoring assumes a 1 to 5 rubric such as the one in the sales call scorecard template.
Coaching activity metrics (leading)
Metric
What it measures
Formula
Data source
Review
Typical owner
1. Sessions per rep per month
Coaching volume
Coaching sessions held ÷ reps ÷ months
Coaching log, calendar or CRM activity
Monthly
Frontline manager
2. Coaching coverage
Whether every rep gets coached, not just the favourites or the strugglers
Reps with at least one skill-focused session in the period ÷ total reps
Coaching log
Monthly
Sales director or enablement
3. Skill focus rate
Whether sessions target the cycle’s skill or drift into deal reviews
Sessions tagged to the coached skill ÷ all coaching sessions
Coaching log with a skill field
Monthly
Enablement
4. Time from call to feedback
How fresh feedback is when the rep hears it
Median of (feedback timestamp − call or role-play timestamp), in days
Conversation intelligence or role-play tool, coaching log
Weekly
Frontline manager
Coaching quality metrics (leading)
Metric
What it measures
Formula
Data source
Review
Typical owner
5. Rubric-score movement on the coached skill
Skill improvement on the dimension being coached
(Average end-of-cycle score − average baseline score) for coached reps, minus the same change for a comparison group
Call scorecards, AI role-play scores
End of each cycle
Enablement
6. Manager calibration gap
Whether managers score the same call the same way
Average of |manager score − panel median| across a shared set of calls; per manager, the average signed difference shows who scores high or low
Calibration session scores
Quarterly, or monthly while new
Enablement or sales operations
Behaviour change metrics (leading)
Metric
What it measures
Formula
Data source
Review
Typical owner
7. Behaviour adoption rate
How often the coached behaviour appears on later calls or role-plays
Later eligible calls where the behaviour is observed ÷ later eligible calls reviewed
Scorecards, conversation intelligence trackers, role-play scoring
Every two weeks
Frontline manager
8. Behaviour persistence
Whether the change survives after coaching moves on
Adoption rate 60 to 90 days after the cycle ÷ adoption rate in the cycle’s last four weeks
Same as adoption
Once per cycle, 90 days on
Enablement
Outcome metrics (lagging, correlational without a comparison group)
Metric
What it measures
Formula
Data source
Review
Typical owner
9. Stage conversion in the coached area
Whether the stage the skill affects converts better
Opportunities that moved from stage X to the next stage ÷ opportunities that entered stage X in the period (coached vs comparison reps)
CRM stage history
Monthly, judged quarterly
Revenue operations
10. Win rate in the coached area
Whether deals where the skill applies close more often
Closed-won ÷ (closed-won + closed-lost) for opportunities in scope, by cohort
CRM
Quarterly
Revenue operations
11. Ramp time
How long new reps take to reach full productivity
Days from start date to the first month at or above your defined ramped-productivity threshold
HR system and CRM
Per hiring cohort
Enablement with revenue operations
What the research says about these metrics
Published evidence supports measuring coaching approach, feedback speed and scorer consistency, but none of it is causal.
- Coaching approach and win rate. In the CSO Insights 2019 Sales Enablement Report (Miller Heiman Group, 2019; over 900 participants), organisations with a dynamic coaching approach reported a 55.2% win rate on forecast deals, against 41.8% for a random approach and a study average of 46.4%. It is a survey, so it shows association, not cause.
- Manager time. The Alexander Group’s span-of-control article (undated) puts first-line sales manager coaching time at about 16% of the week against a 28% best practice, with an average of about 8.5 direct reports. That gap is why coverage and focus rate matter.
- Feedback speed. In Revspire’s sales practice and coaching benchmark (Revspire, last updated 17 October 2026; aggregated, anonymised customer data, 12 months to October 2026), reps who got manager feedback within 7 days of a role-play improved their score by 0.7 points on a 1 to 5 scale, against 0.2 points for reps who received none. The page calls this a correlation: managers may give quick feedback to reps they expect to improve.
- Feedback volume and team size. The same benchmark found the median rep received 4 pieces of manager feedback a month, falling from 6 on teams of five to 2 on teams of 15 or more. It counts only feedback recorded in Revspire.
- Scorer consistency. When two managers scored the same role-play, their scores differed by a median of 0.4 points, and AI and manager scores were within 0.5 points in 86% of role-plays scored by both (same benchmark). More broadly, Scullen, Mount and Goff (Journal of Applied Psychology, 2000) found idiosyncratic rater effects explained 62% and 53% of rating variance in two samples of 2,350 and 2,142 managers, against 21% and 25% for actual performance. Track calibration before trusting rubric movement.
- Practice and live deals. Revspire’s sales practice to performance benchmark (Revspire, last updated 17 October 2026) found deals advanced 48% of the time when the rep completed an AI role-play before that stage, against 36% without. The page notes these are correlations and reps often rehearse deals already moving.
- Ramp baseline. The Bridge Group’s 2025 SDR research (6 February 2025; 351 B2B companies) reports an average SDR ramp time of 3.0 months. It is SDR-only context; set your own baseline for account executives.
For more third-party figures and how strong each one is, see Revspire’s sales coaching statistics page, which grades the strength of each figure.
Worked example: how to measure sales coaching effectiveness
This example is fictional. Larkfield Software is an invented company, and every number in this section is made up to show the arithmetic.
Larkfield has 4 frontline managers and 32 account executives. In a 12-week cycle, the coached skill is quantifying business impact in discovery, scored 1 to 5 on one rubric dimension. Twenty-six reps are coached on it; six reps, coached on a different skill that quarter, form the comparison group.
Activity
- Sessions per rep per month: 224 sessions ÷ 32 reps ÷ 3 months = 2.3.
- Skill focus rate: 151 discovery-tagged sessions ÷ 224 = 67%. A third of sessions drifted into deal reviews.
- Coverage: 26 coached reps ÷ 32 = 81%. The six comparison reps are excluded by design, so the target here is 26 of 26.
- Time from call to feedback: median 4 days overall; by manager 1, 3, 5 and 9 days.
Quality
Rubric movement: coached reps went from 2.5 to 3.1 (+0.6); comparison reps went from 2.6 to 2.7 (+0.1). Net movement attributable to the cycle, at best: 0.6 − 0.1 = +0.5 points.
Calibration gap: all four managers scored the same three recorded calls.
Call
Manager A
Manager B
Manager C
Manager D
Panel median
Call 1
3.0
3.5
2.5
3.0
3.0
Call 2
2.0
3.0
2.0
2.5
2.25
Call 3
4.0
4.5
3.5
4.0
4.0
The absolute differences from the median add up to 3.5 across 12 scores, so the team calibration gap is 3.5 ÷ 12 = 0.29 points. Per manager, the average signed difference is A −0.08, B +0.58, C −0.42 and D +0.08: Manager B scores generously and Manager C harshly. Until fixed, B’s team will look better than it is. The manager calibration rubric guide covers how to run the session itself.
Behaviour
Adoption rate: before the cycle, reviewers found impact quantified on 30 of 120 discovery calls (25%). In weeks 5 to 12, coached reps did it on 96 of 160 discovery calls (60%); comparison reps on 9 of 30 (30%). Persistence is checked again 60 to 90 days later.
Outcome
Discovery to evaluation conversion: coached reps moved from 84 of 210 (40.0%) last quarter to 99 of 220 (45.0%), up 5.0 points. Comparison reps moved from 18 of 50 (36.0%) to 19 of 52 (36.5%), up 0.5 points. The gap supports the coaching story, but six reps is a small, non-random comparison group, so Larkfield reports it as correlational. Win rate in the coached area is read next quarter, because deals that entered discovery this cycle have not closed yet.
How to set up sales coaching measurement in 30 days
- Days 1 to 5: pick one skill and define it. Write the behaviour as something a reviewer can see on a call (“states a quantified business impact and confirms it with the buyer”), add it as a rubric dimension and choose the stage it should affect.
- Days 6 to 10: take a baseline. Score a sample of recent calls per rep on that dimension, record the current adoption rate and pull last quarter’s stage conversion from CRM history. Choose a comparison group.
- Days 11 to 15: calibrate. Have every manager score the same three to five calls, compute the calibration gap and agree what a 3 and a 4 look like.
- Days 16 to 25: instrument the log. Add a skill field and a timestamp to every coaching session so focus rate and time to feedback calculate themselves. The AI-assisted sales coaching templates show the session fields worth capturing.
- Days 26 to 30: first review. Review the activity metrics weekly from here, behaviour every two weeks and outcomes monthly, and agree in advance what result would change the skill or approach.
Common sales coaching measurement mistakes
- Vanity counts. Sessions held, hours logged and calls listened to are easy to inflate. Pair every volume metric with focus rate and coverage.
- Measuring sessions, not behaviour. A perfect activity dashboard says nothing about whether reps changed. Adoption on later calls is the metric that connects coaching to results.
- No baseline. Without a pre-cycle score, adoption rate and conversion figure, any end-of-cycle number is uninterpretable.
- Uncalibrated scores. If managers score differently, rubric movement measures the manager as much as the rep.
- Reading outcomes too early or as causal. Win rate needs a full sales cycle, and without a comparison group it only moved alongside coaching.
Tools that capture these metrics
Most teams combine a coaching log, a conversation intelligence or role-play tool, and CRM stage history. If role-play is part of your coaching, Revspire’s AI Sales Training & Coaching provides instant AI scoring for clarity, confidence and objection handling and tracks team readiness and improvement. For a vendor view, see the AI sales coaching software comparison.
Ready to run your first measured cycle? Start with the sales coaching template, which gives you the coaching plan and one-to-one structure that these metrics read from.
Frequently asked questions
What are the most important sales coaching metrics?
Start with four: coaching coverage, time from call to feedback, rubric-score movement on the coached skill and behaviour adoption rate on later calls. They are all leading indicators you can act on within weeks. Add stage conversion in the coached area as the lagging check once a full cycle has passed.
How do you measure sales coaching effectiveness?
Take a baseline on one skill, coach it for a defined cycle, then compare the change in rubric score and behaviour adoption for coached reps with a group that was not coached on that skill. Check stage conversion and win rate for the same cohorts afterwards. Without the comparison group, treat outcome changes as correlational.
What KPIs should sales managers track for coaching?
Frontline managers should own sessions per rep, coverage, time to feedback and adoption rate, because they can change them this week. Enablement typically owns rubric movement and calibration; revenue operations owns stage conversion, win rate and ramp time.
Is win rate a good sales coaching KPI?
Only as a lagging, scoped measure. Overall win rate is driven by pricing, competition, territory and pipeline quality, so limit it to opportunities where the coached skill applies and compare cohorts. Expect to wait at least one sales cycle before reading it.
How often should you review sales coaching metrics?
Review activity metrics weekly, behaviour adoption every two weeks, rubric movement at the end of each coaching cycle, and outcome metrics monthly with a quarterly judgement. Run a calibration check at least quarterly.
Sources
- 2019 Sales Enablement Report: CSO Insights Fifth Annual Sales Enablement Study, CSO Insights (Miller Heiman Group), 2019, hosted by Highspot. Accessed 26 October 2026.
- What Is the Right Span of Control for First-Line Sales Managers (FLSMs)?, Alexander Group, undated. Accessed 26 October 2026.
- Understanding the latent structure of job performance ratings, Scullen, Mount and Goff, Journal of Applied Psychology 85(6), 2000. Accessed 26 October 2026.
- SDR tenure and ramp time (SDR Models, Motions & Metrics: 2025 Research Report), The Bridge Group, 6 February 2025. Accessed 26 October 2026.
- The Kirkpatrick Model, Training Industry, last modified 16 March 2026. Accessed 26 October 2026.
- Sales practice and coaching benchmark, Revspire, last updated 17 October 2026. Accessed 26 October 2026.
- Sales practice to performance benchmark, Revspire, last updated 17 October 2026. Accessed 26 October 2026.
- Sales coaching statistics, Revspire, last updated 15 October 2026. Accessed 26 October 2026.