Revspire blog
The Complete 2026 Guide to Rolling Forecast Models for Revenue Leaders
Build rolling forecast models for B2B sales with clear ownership, pipeline stages, leading indicators, deal coaching, and feedback loops.
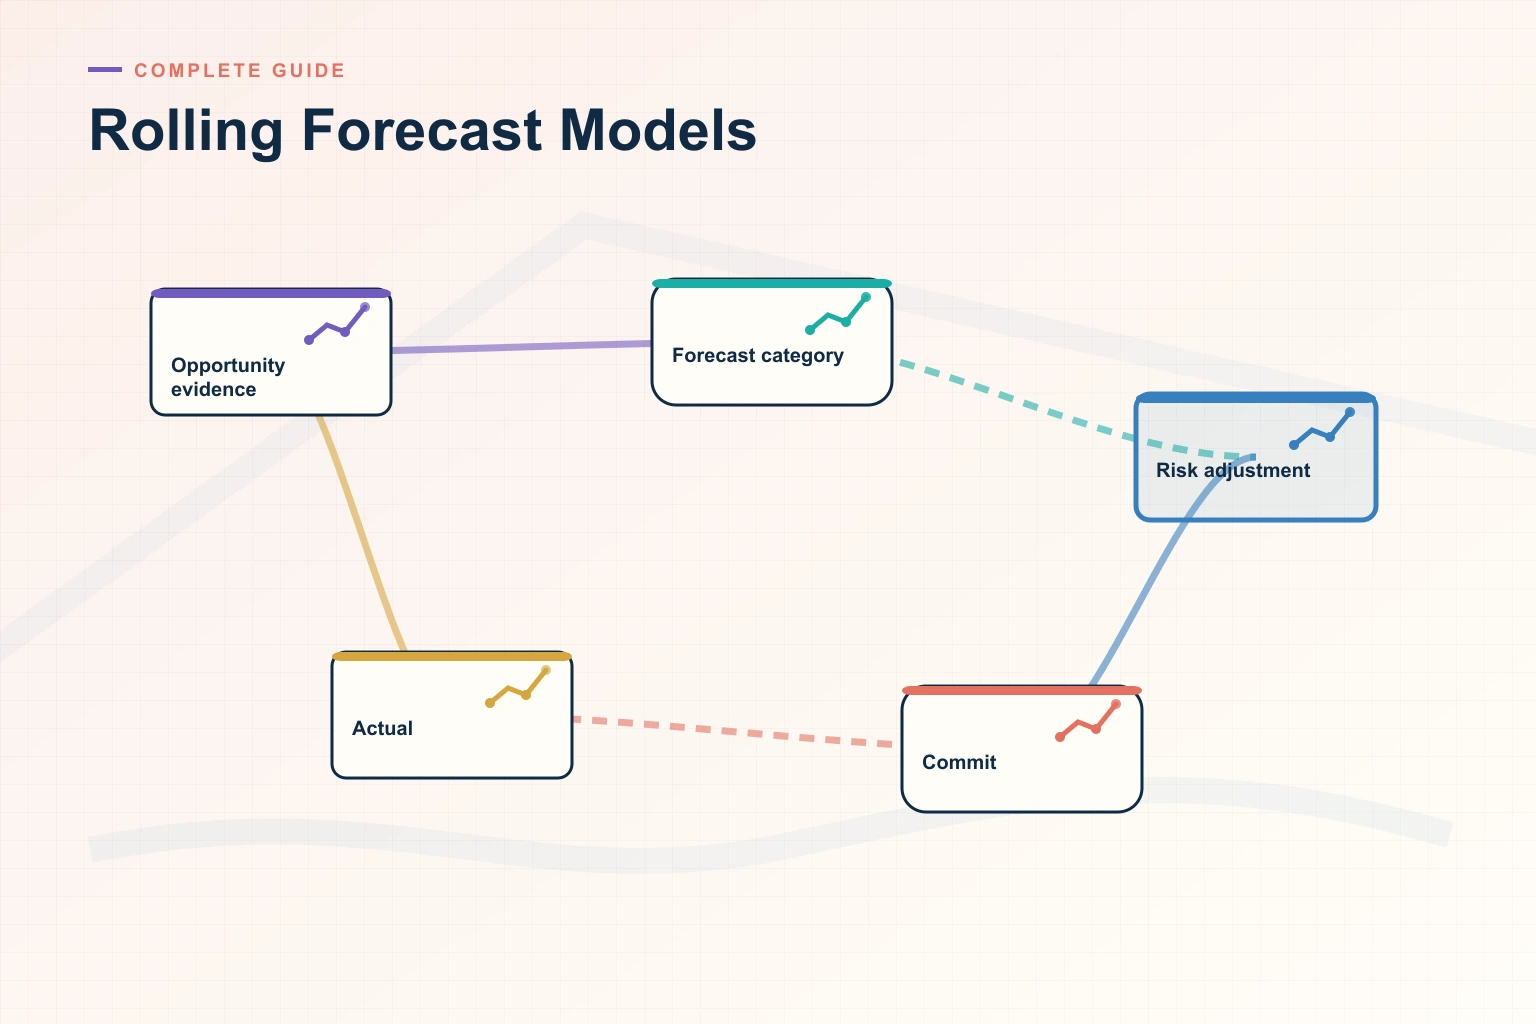
In this guide, “rolling forecast models” refers specifically to the B2B sales-pipeline and deal-execution practice described in the supplied posts: a continuous discipline built around opportunity data, stage expectations, ownership, coaching, and feedback. It is not presented here as a definition of financial-planning forecasts.
The practical goal is to replace reactive forecasting based on tribal knowledge and manager intuition with a documented operating model that revenue teams can review and improve.
Build the operating model
Start by establishing an honest baseline. Pull the last six months of deal data. Map opportunities against pipeline stages, identify where deals are falling out, and examine the affected representatives, segments, and deal sizes.
An operating model should specify what actions should happen, at what stage, and who is accountable. Keep it usable: a simple process that the team follows is more useful than a sophisticated process that the team ignores.
Assign a permanent owner to the practice. That owner should set goals, define metrics, maintain standing reviews, and update the approach as conditions change.
Explore Revspire Deal Intelligence.
Three-part explainer: Define the system, Operationalize the workflow, and Measure the impact.
Define stages and measurements
Write down what excellent execution looks like at each deal stage. Include clear milestones, documented criteria, a shared vocabulary, required actions, and accountable owners.
Combine leading and lagging indicators. Leading indicators might include stakeholder engagement, content consumption, mutual action plan progression, and deal velocity. Lagging indicators include win rate, cycle time, average deal size, and quota attainment.
Build a dashboard that shows both types of indicator, review it weekly, and connect it to coaching conversations and territory reviews.
Embed the practice into weekly work
- Review the pipeline weekly. Use the meeting as a structured conversation about what needs to change during the next seven days, not only as a status update.
- Coach from live opportunities. Review current deals with each representative, identify where execution is breaking down, and work through the correction in context.
- Capture win-loss intelligence. Use post-deal interviews, CRM analysis, and structured reviews to update playbooks, training, and strategy.
- Align technology with the process. Technology should serve the rolling forecast model B2B sales process, not define it.
- Create feedback loops. Review metrics against targets, update playbooks when the team learns something new, and incorporate buyer feedback.
Three-part explainer: Set the standard, Embed the practice, and Scale what works.
Correct common execution mistakes
Treating the practice as a one-time initiative
A project with a start and end date can drift when daily pipeline pressure takes over. Assign a permanent owner and maintain standing reviews, defined metrics, and quarterly improvement goals.
Relying on intuition instead of portfolio data
Define three to five leading indicators and track them weekly. When the data and the team’s interpretation disagree, investigate the discrepancy.
Single-threading stakeholder relationships
Map the buying committee, assign coverage, and flag deals with only one active contact as high risk.
Confusing activity with progress
Measure outcomes, not activities. Track stage progression velocity, buyer engagement quality, and stakeholder coverage breadth.
Failing to learn from losses
Use a structured review after significant lost deals. Document the execution breakdowns and update the relevant playbooks.
Consider the broader themes carefully
One supplied post also argues that a strong practice can help attract, develop, and retain top-performing revenue professionals. Because the frozen material provides no supporting research for that outcome, this guide records the theme without presenting it as an established result.
The same evidence limitation applies to the repeated claim that rolling 12-month forecasts reduce planning cycle time by 35%. The figure has been removed because the frozen sources provide no study, methodology, publisher, date, or primary citation.
Three-part explainer: Expose the hidden cost, Build the business case, and Start where it matters.
Next step
Begin with a baseline, select two or three specific improvements, assign clear owners, define measurable goals, and use a 90-day review cadence.