CRM Data Quality for Forecasting: The Fields, Metrics and Fixes
A practical perspective for connecting this idea to your revenue team’s next move.
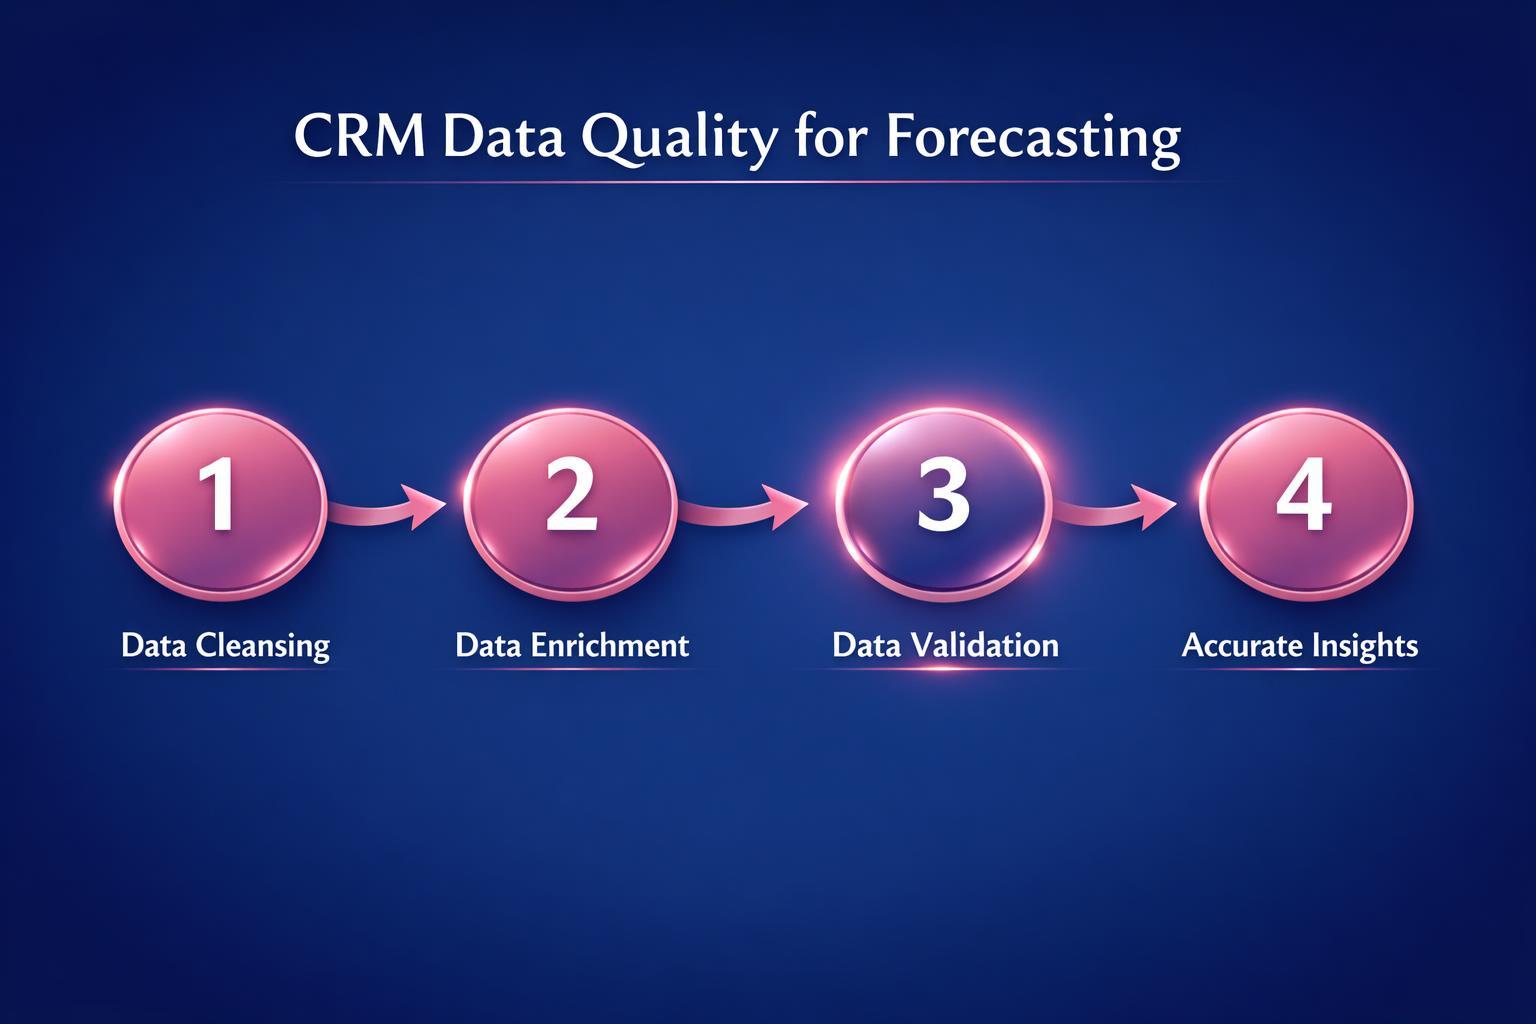
CRM data quality for forecasting is how complete, accurate, current and consistently defined the opportunity fields behind your forecast are: stage, close date, amount, forecast category, next step and buyer contacts. When sellers update those fields from hope rather than buyer evidence, every forecast method built on them inherits the error, however good the model is.
The gap is common. In Gartner’s State of Sales Operations survey, reported by Gartner in February 2020, only 45% of sales leaders and sellers had high confidence in their organization’s forecast accuracy, and only 47% said their organization had high-quality data. This guide covers which fields matter, how to measure them, why they go wrong and a 30-day plan to fix them. It reflects CRM features and research checked in October 2026.
Last updated: 17 October 2026
What is CRM data quality for forecasting?
Data quality means data is fit for the job it has to do. Gartner’s data quality overview (accessed October 2026) defines it as the usability and applicability of data for an organization’s priority use cases and lists nine dimensions: accessibility, accuracy, completeness, consistency, precision, relevancy, timeliness, uniqueness and validity. A sales forecast is a narrow use case (which deals close, in which period, for how much), so six of those dimensions do most of the work:
- Completeness: every open deal has the fields the forecast reads, not just the ones the page layout makes mandatory.
- Accuracy: values match reality. The close date is when the buyer expects to sign, not the last day of the quarter.
- Timeliness: fields were updated after the last buyer interaction, not once at the start of the quarter.
- Consistency: a stage name means the same buyer evidence for every seller, team and region.
- Validity: values sit inside allowed formats and ranges: no past close dates on open deals, no $1 placeholder amounts.
- Uniqueness: one account and one opportunity per real deal, so activity is not split and pipeline is not counted twice.
Survey data suggests most teams fall short. In Validity’s The State of CRM Data Management in 2025 (602 CRM users and stakeholders), 76% said less than half of their organization’s CRM data is accurate and complete, and 37% reported losing revenue as a direct consequence of poor data quality. Xactly’s 2024 Sales Forecasting Benchmark Report (405 sales and finance professionals in North America, surveyed in March 2024) found that 80% had missed at least one forecast in the past year; 66% said their reporting systems cannot access historical CRM or performance data, and 60% were unsure where their pipeline data comes from. Across all uses, not only sales, Gartner research from 2020 put the cost of poor data quality at an average of at least $12.9 million a year per organization.
Which CRM fields does a sales forecast depend on?
Whether the forecast is a manager’s call, a stage-weighted roll-up or an AI projection, it reads the same handful of opportunity fields. Each fails in a predictable way and has a control that prevents most of the damage.
Field
What the forecast uses it for
How it usually goes wrong
Control that helps most
Stage
Probability weighting and stage conversion rates
Sellers apply different criteria; stage moves on seller activity, not buyer action
Exit criteria written as buyer evidence; required fields per stage
Close date
Which period the deal lands in
Set to quarter end, pushed repeatedly, left in the past on open deals
Future-dates-only rule; close-date push count; date agreed in a mutual action plan
Amount
How much the deal counts
Placeholder or list price; raised late in the quarter to close a gap
Required from proposal stage; minimum value; change report in the final weeks
Forecast category
Commit and best-case roll-ups
Overridden without evidence; good deals held back (sandbagging)
Written category rules; manager overrides recorded, not silent
Next step and date
Whether the buyer has agreed to anything
Blank, “follow up” or a date already passed
Next-step date required and in the future on late-stage deals
Contacts and roles
Buying-group coverage and single-thread risk
Only the champion recorded; contacts who have changed jobs
Roles checked before commit; contact refresh on late-stage deals
Loss reason
Next quarter’s conversion rates and risk rules
“Other”, or price and competitor chosen by default
Required picklist; a note required when “Other” is chosen
If you can only enforce three, make them close date, amount, and next step with a date. Together they decide which period a deal lands in, how much it counts, and whether anyone on the buyer side has agreed to the next move.
Why is CRM data so often wrong?
Most forecast fields record what the seller believes
Stage, close date and amount are typed by the seller. A deal can sit in Negotiation with a close date this month while the buyer has not replied for six weeks. The record is complete and valid, and still wrong. That is why completeness checks alone never fix a forecast: the fields that matter most are judgments, so they need evidence behind them.
Stage names mean different things to different sellers
One seller moves a deal to Negotiation on a verbal yes, another when the contract is sent, a third after a promising call. A stage-weighted forecast then applies the same probability to three different situations. Stage definitions only become data once each stage has an exit criterion the buyer has to meet, such as “security review started” or “buyer confirmed signatory and date”.
Incentives push the numbers in both directions
If missing a commit is punished and under-calling is not, sellers sandbag: good deals stay out of commit and appear late. If a large pipeline earns praise, early-stage amounts and probabilities inflate. Either way the CRM records a negotiating position rather than a forecast. Measure forecast bias in both directions and recognize sellers whose calls land close to the result; our guide to sales forecasting methods shows how to calculate accuracy and bias from a fixed forecast snapshot.
Contacts and roles decay
People change jobs, and the CRM does not notice. The US Bureau of Labor Statistics’ Employee Tenure Summary (September 2026) put median tenure with the current employer at 4.1 years for wage and salary workers in January 2026, and 4.9 years in management, professional and related occupations. On accounts you have sold to for years, some recorded contacts will have moved on, so check names and roles on every late-stage deal instead of trusting the contact list.
Loss reasons are typed to close the record
Loss reasons feed the conversion rates and risk rules you forecast with next quarter, yet they are often chosen in a hurry. In Revspire’s B2B SaaS win rate and sales cycle benchmark (about 40 B2B companies, October 2025 to September 2026), only 10% of closed-lost deals carried a “no decision” or status-quo reason. The benchmark treats that as a floor, because sellers tend to record a competitor or price rather than “the buyer did nothing”.
Duplicates and disconnected systems split the picture
A duplicate account splits activity history, so a deal can look single-threaded when the buyer’s colleagues are logged against a second record. Duplicate opportunities count pipeline twice. Integration gaps make it worse: in Xactly’s 2024 survey, 33% said they were unable to easily integrate systems to maintain pipeline accuracy.
How do you measure CRM data quality?
There is no published industry standard for a “good” CRM data quality score, so set your own baseline and track the trend. Gartner’s data quality guidance recommends choosing the two or three dimensions most relevant to the use case and profiling data against business rules, not just counting blanks. For a forecast, these checks cover most of the risk. Run them weekly on open pipeline and monthly on closed deals.
Check
How to calculate it
What it tells you
Forecast-field completeness
Open deals with every required forecast field filled ÷ open deals, by stage
Whether the forecast has the inputs it assumes
Past-due close dates
Open deals with a close date before today ÷ open deals
Records nobody is maintaining
Close-date pushes
Share of open deals whose close date has moved two or more times (from field history)
Optimism and slippage, deal by deal
Stage age
Days in current stage compared with the median for won deals at that stage
Stuck deals still carrying forecast weight
Late amount changes
Deals whose amount changed in the last two weeks of the period
Numbers managed to the target rather than the buyer
Single-threaded commit
Commit deals with one or no active buyer contact ÷ commit deals
Revenue resting on one person
Stale next steps
Late-stage deals with a blank or past next-step date
Deals with no agreed buyer action
Duplicate rate
Records flagged by matching rules ÷ total records
Split activity and double-counted pipeline
Vague loss reasons
Closed-lost deals with a blank or “Other” reason ÷ closed-lost deals
Whether next quarter’s risk rules can trust this quarter’s losses
Report each check by seller and by stage: a healthy team-wide rate can hide one region’s half-empty late-stage deals. The goal is knowing which part of the forecast rests on data you can trust.
Worked example: the same commit, before and after a data check
The figures below are illustrative, not from a real team. A manager’s commit for the quarter, as recorded in the CRM, totals $600,000 across five deals. A ten-minute data check on 16 October changes the picture without changing any forecasting method.
Deal
CRM amount
What the data check found
Evidence-adjusted call
A
$180,000
Signing date agreed in a mutual action plan; four buyer contacts active this week
Commit, $180,000
B
$150,000
Close date pushed three times; no buyer activity for 26 days
Best case, $150,000
C
$120,000
Amount raised from $80,000 last week with no revised quote; one contact
Commit at $80,000; $40,000 best case until a quote is sent
D
$90,000
Procurement and security steps dated and owned by the buyer
Commit, $90,000
E
$60,000
Open deal with a September close date
Out of the forecast until re-dated with the buyer
Commit falls from $600,000 to $350,000, with $190,000 in best case and $60,000 removed. Nothing was wrong with the roll-up maths; three of the five records simply described what the seller hoped. Running the same check every week is what stops the gap from appearing in the last fortnight of the quarter.
How do you improve CRM data quality for forecasting?
1. Write a one-page data dictionary for forecast fields
For each field in the table above, write the definition, allowed values, who updates it and by when. Gartner’s February 2020 release advised sales leaders to set data quality standards that follow from what the CRM is for. Start with stage exit criteria, because every other field depends on what a stage means.
2. Enforce a few rules where data is entered
In Salesforce, a validation rule is a formula checked when a record is saved; if it returns true, the record does not save and the seller sees your error message. Rules apply to new and updated records even when the fields they check are not on the page layout or in the API call, though not to records created with Quick Create. HubSpot’s property validation rules (HubSpot Knowledge Base, updated September 2026) are available on all plans, support future-dates-only rules for dates and minimum and maximum values for numbers, and reserve custom regex rules for Professional and Enterprise. They do not reformat existing values, and workflows do not enforce them. Rules worth starting with:
- An open opportunity cannot be saved with a close date in the past.
- Amount is required, and above zero, from the proposal stage onward.
- Late-stage deals need a next-step date in the future.
- Closed-lost needs a loss reason from a picklist, and “Other” needs a note.
Keep rules few and tied to stage: rules sellers resent get answered with placeholder values, which is worse than a blank.
3. Stop duplicates at the door
Salesforce’s duplicate management uses matching rules to decide what counts as a duplicate and duplicate rules to decide what happens: warn the user, or block the record, with different rules for different profiles. Duplicate jobs find existing duplicates across the org so they can be merged. Block at entry for accounts and contacts, then clear the backlog once.
4. Keep a history of the fields that move the forecast
Close-date pushes and stage regressions are the clearest early warnings, and you can only count them with history. Salesforce field history tracking records the date, time, change and user for tracked fields and keeps history for up to 18 months (24 months through the API) unless Field Audit Trail is on. It does not track decimal field types such as currency and percent, so confirm how your org records amount changes, for example with a reporting snapshot, before you build a late-amount-change check.
5. Capture buyer evidence instead of asking sellers to type it
The most reliable fields are the ones nobody has to remember to update: a buyer opening a proposal, a new stakeholder joining, a buyer-owned milestone being completed. Revspire Digital Sales Rooms record buyer views, the stakeholders who open each room and mutual action plan milestones with owners and due dates, and Revspire integrates with Salesforce, HubSpot, Microsoft Dynamics 365, Zoho CRM and Pipedrive. Any source of logged buyer activity works for the checks in the next section.
6. Inspect data in the weekly forecast call
Gartner’s 2020 release also found that many organizations do not measure data quality or build it into recurring conversations between managers and sellers. Spend the first ten minutes of the forecast call on exceptions:
- Open deals with a past close date.
- Deals whose close date moved twice or more.
- Commit deals with one active buyer contact.
- Late-stage deals with no next-step date.
- Amounts that changed since last week, and why.
Our pipeline hygiene guide covers the wider weekly clean-up routine.
How can buyer engagement data check what the CRM says?
Seller-entered fields say what the seller expects; logged buyer activity says what the buyer is doing. Comparing the two is the fastest way to find records that need a conversation, so check each late-stage deal on four signals plus whether the buyer owns any steps in the plan. Treat the starting rules below as thresholds to calibrate against your own won and lost deals, not research findings.
Signal
What to check
Starting rule
Observed pattern in Revspire data
Recency
Days since the last buyer action (reply, meeting, view)
Review any commit deal quiet for 14 days
After 20 days with no buyer view of a deal room, win rate fell below half the overall rate
Breadth
Distinct buyer-side people engaged
Flag commit deals with fewer than three
Deal rooms reached 15 unique buyer stakeholders, against 1 to 5 on deals without one
Depth
Which material the buyer is reading
Proposal, pricing or security material viewed before commit
80% of views in the 14 days before a won deal closed went to the proposal and implementation plan
Momentum
Engagement trend over the last two weeks
A falling trend on a commit deal triggers a review
None published
Buyer-owned plan
Dated milestones the buyer has agreed to own
At least one before a deal enters commit
Buyers owned 20% of mutual action plan milestones
The patterns come from Revspire’s digital sales room benchmark and mutual action plan benchmark, both aggregated from customer data for October 2025 to September 2026. They are observed associations, not proof that any tool caused a result. When the signals disagree with the CRM, as with deal B in the worked example, the record changes or the seller explains why it should not.
Should you use AI enrichment to fix CRM data?
AI enrichment fills and refreshes account and contact fields, such as industry, employee count, job title and seniority, by matching CRM records against commercial and public data and picking the value most likely to be correct. It fixes completeness fast. Whether it improves accuracy depends on three controls: auditing a sample of what it writes, limiting which fields it may write, and deciding when it may overwrite a value a person entered.
Its effect on the forecast is indirect: enrichment never touches stage, amount or close date, but it keeps contacts and roles current for the coverage checks above and puts each account in the right segment, so conversion and cycle comparisons use the right baseline.
What enrichment fills, and the default write rule
Field group
Examples
Forecast use
Default write rule
Company firmographics
Industry, employee count, revenue band, country, domain
Segment baselines; duplicate matching
Fill blanks; review before overwriting fields that drive routing
Contact role
Job title, seniority, department
Buying-group coverage
Fill blanks; flag changes on open deals to the owner
Contact status
Still at the company, new employer
Contact decay, champion departures
Flag; never delete automatically
Technographics and hiring
Tools used, open roles
Prioritization, not the forecast
Separate fields only
Forecast fields
Stage, close date, amount, category, next step
The forecast itself
Never enriched; AI may suggest, the seller confirms
Suggested defaults; adjust to your field ownership.
Check how your tool behaves first. HubSpot’s data enrichment, for example, matches contacts on name and work email and companies on domain, draws on HubSpot’s commercial dataset, third-party providers and public information, and keeps existing data unless you choose to overwrite it (HubSpot Knowledge Base, updated 10 July 2026). Its settings give each property an overwrite rule (fill empty values only, fill and overwrite, or do not fill); when continuous enrichment is set to overwrite incorrect enrichment values, values set manually, by workflows or by integrations are left alone, but conversational enrichment and the workflow “Enrich record” action can overwrite regardless of those rules (HubSpot Knowledge Base, updated 31 July 2026).
Accuracy and decay checks
- Match and fill rate: records matched and blank fields filled, by segment.
- Sample audit: each quarter, check a fixed sample of enriched records per segment (50 is a workable start) against company websites and public profiles, and record the error rate by field.
- Conflict rate: how often the enriched value disagrees with one a person entered. A high rate on one field needs investigating before you allow overwrites.
- Decay: US employers recorded 5.1 million separations in August 2026, a monthly rate of 3.2% (US Bureau of Labor Statistics, 29 September 2026), so contact data goes stale every month. Track bounce rate and the share of late-stage contacts not verified in 90 days.
- AI-inferred values: label values a model inferred, such as seniority guessed from a title, separately from matched ones. NIST’s Generative AI Profile lists confabulation, “the production of confidently stated but erroneous or false content”, as a risk and recommends checking output against known ground truth (NIST AI 600-1, July 2024).
Governance: who may write which field
Give every enriched field an owner, a source of truth and two companion fields: source and date last verified. Enriched contact details are personal data, and the European Commission’s summary of GDPR principles says data held must be “accurate and kept up-to-date”, with inaccurate data corrected or deleted without delay (European Commission, undated). Test bulk runs on a sample and keep field history on, so a bad batch can be reversed.
When not to auto-overwrite
- The value was confirmed with the buyer, such as a buying role recorded after a meeting.
- The field drives territory, routing or commission: a silent change to employee count or region can move accounts between sellers mid-quarter.
- Legal entity, billing and contract fields that finance owns.
- Consent, opt-out and deletion records: enrichment must never re-create a contact who objected or was deleted.
- Contacts on late-stage deals: notify the owner instead of silently replacing the champion’s title or company.
- The provider’s value is older than the one you hold.
A champion’s new employer is also a selling signal: see the signal-based selling guide.
Can AI forecasting fix bad CRM data?
Not on its own. A model trained on past stages, close dates and amounts learns the habits that produced them, including optimistic dates and inconsistent stages. Data leaders recognize this: in Salesforce’s State of Data and Analytics research (published November 2025, about 3,800 analytics and IT decision makers), data and analytics leaders estimated 26% of their organization’s data is untrustworthy, 84% said their data strategies need a complete overhaul before their AI ambitions can succeed, and 89% of those with AI in production had seen inaccurate or misleading outputs.
AI does help in three narrower ways: flagging anomalies such as repeated pushes or late amount changes, adding signals sellers do not type (email, meeting and buyer engagement activity), and drafting field updates from calls and emails for the seller to confirm. Fix definitions and entry rules first, then judge an AI forecast by comparing its snapshot with the result each period.
A 30-day plan to fix the data behind your forecast
- Week 1, baseline. Pull six months of closed deals and all open pipeline. Run the checks in the scorecard and break the results down by seller, segment and deal size. Compare median days to close with your close dates: in the Revspire benchmark, the median won deal closed in 20 days under $10,000, 45 days at $10,000 to $50,000 and 90 days above $50,000, so a $200,000 deal created last week with a close date this month needs a reason.
- Week 2, definitions and rules. Publish the data dictionary and stage exit criteria. Switch on three or four validation rules and duplicate blocking for accounts and contacts.
- Week 3, inspection. Add the ten-minute exception review to every forecast call. Add buyer-engagement checks to late-stage deals and agree buyer-owned dates on the largest ones.
- Week 4, compare. Set the forecast snapshot you will judge accuracy against, and record which records changed after the data check. Choose two or three improvements for next quarter, each with an owner, a measurable goal and a review date.
To put buyer-agreed dates behind your close dates, start with our mutual action plan template.
Evaluating the rest of your sales stack? Our roundup of the best B2B sales tools and software compares the main tool categories side by side.
Frequently asked questions
How does CRM data quality affect forecast accuracy?
Every forecast method reads the same opportunity fields, so errors in stage, close date or amount flow straight into the number. Past-due close dates put deals in the wrong period, inconsistent stages skew weighted forecasts, and inflated amounts overstate commit. Better data does not guarantee an accurate forecast, but bad data guarantees an unreliable one.
What are the dimensions of CRM data quality?
Gartner lists nine data quality dimensions: accessibility, accuracy, completeness, consistency, precision, relevancy, timeliness, uniqueness and validity. For forecasting, focus on completeness, accuracy, timeliness, consistency, validity and uniqueness of the opportunity fields the forecast reads.
How often should you clean CRM data for forecasting?
Check open pipeline weekly, as part of the forecast call, and review closed deals, duplicates and contacts monthly or quarterly. A one-off clean-up decays within a quarter if entry rules and inspection habits do not change.
What is a good CRM data quality score?
No published industry standard exists, so measure your own baseline and improve the trend. A practical target is full completeness and no past-due close dates on commit and best-case deals, because those records decide the number leadership reports.
Who is responsible for CRM data quality?
Name one owner for the standard, usually RevOps or sales operations, who maintains the data dictionary, validation and duplicate rules and the weekly exception report. Frontline managers own weekly inspection, sellers own updating forecast fields after each buyer interaction, and finance reconciles bookings with the forecast snapshot. The CRO owns the incentives: reward accurate calls rather than optimistic or sandbagged ones.
What is AI CRM enrichment?
AI CRM enrichment automatically fills and refreshes account and contact fields, such as industry, company size, job title and seniority, by matching records against external data and choosing the most reliable value. It improves completeness quickly, but it needs sample audits, field-level overwrite rules and a source and date on each value. Forecast fields such as stage, amount and close date should never be enriched.
Sources
- Gartner Says Less Than 50% of Sales Leaders and Sellers Have High Confidence in Forecasting Accuracy, Gartner, 12 February 2020. Accessed 16 October 2026.
- Data Quality: Why It Matters and How to Achieve It, Gartner, undated topic page (cost figure from Gartner research, 2020). Accessed 16 October 2026.
- The State of CRM Data Management in 2025, Validity, 2025 (page updated 29 January 2026). Accessed 16 October 2026.
- 2024 Sales Forecasting Benchmark Report, Xactly with Regina Corso Consulting, July 2024 (survey 19 to 28 March 2024). Accessed 16 October 2026.
- Study: 84% of Technical Leaders Need Data Overhaul for AI Strategies to Succeed, Salesforce, 4 November 2025. Accessed 16 October 2026.
- Employee Tenure Summary (USDL-26-1532), US Bureau of Labor Statistics, 24 September 2026. Accessed 16 October 2026.
- Validation Rules, Salesforce Help, undated. Accessed 16 October 2026.
- Manage Duplicate Records, Salesforce Help, undated. Accessed 16 October 2026.
- Field History Tracking Overview, Salesforce Help, undated. Accessed 16 October 2026.
- Set validation rules for a property, HubSpot Knowledge Base, updated 10 September 2026. Accessed 16 October 2026.
- B2B SaaS Win Rate and Sales Cycle Benchmark (2026), Revspire, updated 16 October 2026 (data October 2025 to September 2026). Accessed 16 October 2026.
- Digital Sales Room Benchmark, Revspire, 16 October 2026 (data October 2025 to September 2026). Figures checked 17 October 2026.
- Mutual Action Plan Benchmark, Revspire, 16 October 2026 (data October 2025 to September 2026). Figures checked 17 October 2026.
- Get started with data enrichment, HubSpot Knowledge Base, updated 10 July 2026. Accessed 17 October 2026.
- Manage data enrichment settings, HubSpot Knowledge Base, updated 31 July 2026. Accessed 17 October 2026.
- Artificial Intelligence Risk Management Framework: Generative Artificial Intelligence Profile (NIST AI 600-1), National Institute of Standards and Technology, July 2024. Accessed 17 October 2026.
- Job Openings and Labor Turnover Summary (August 2026 data), US Bureau of Labor Statistics, 29 September 2026. Accessed 17 October 2026.
- Principles of personal data processing under the GDPR, European Commission, undated. Accessed 17 October 2026.