Net Revenue Retention (NRR): Definition, Formula, and GRR
A practical perspective for connecting this idea to your revenue team’s next move.
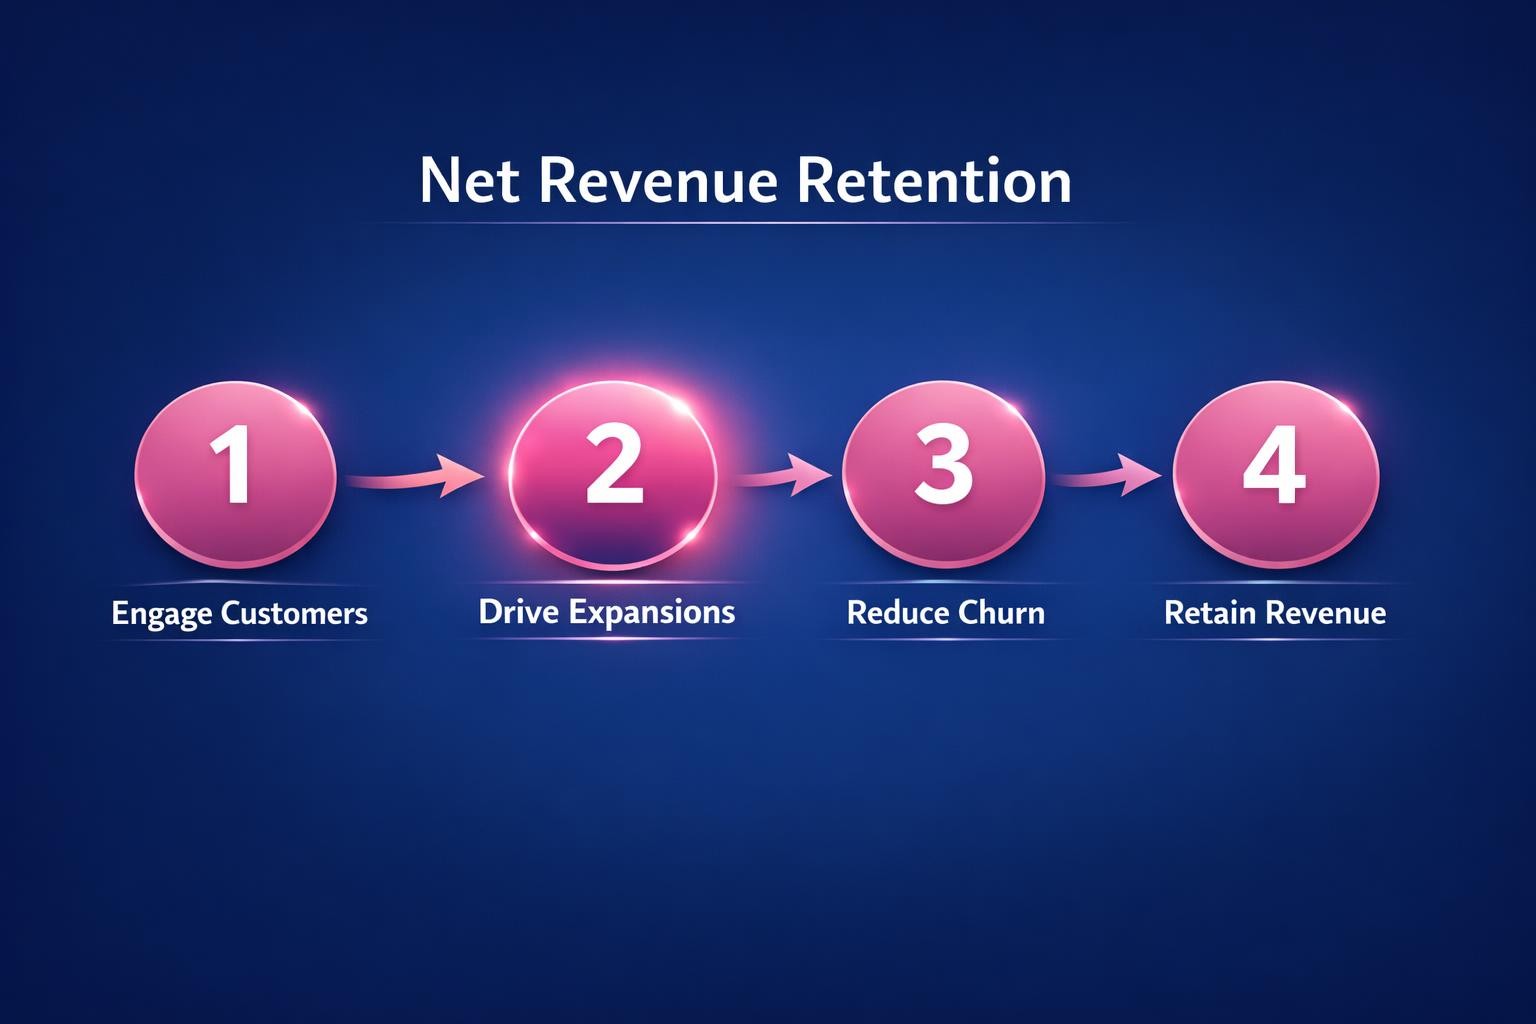
Net revenue retention (NRR) measures the recurring revenue retained from an opening customer cohort over a defined period after expansion, contraction, and churn. New-customer revenue is excluded: the purpose is to show how the same customer base changed. That makes the opening cohort, reporting period, and recurring-revenue basis important parts of the metric definition.
Calculate NRR and compare it with GRR
Use one explicit NRR formula
NRR = (starting recurring revenue + expansion revenue − contraction revenue − churned revenue) ÷ starting recurring revenue × 100.
Use either monthly recurring revenue or annual recurring revenue consistently. Expansion includes recurring upgrades and cross-sells from customers in the opening cohort. Contraction covers recurring downgrades, while churn is recurring revenue lost when customers leave. Zuora’s NRR explanation and formula identifies those same components.
For example, if an opening cohort contributes $100 in recurring revenue, adds $8 through expansion, loses $3 through contraction, and loses $5 through churn, NRR is ($100 + $8 − $3 − $5) ÷ $100 × 100, or 100%. The arithmetic is illustrative; it is not an industry benchmark.
Use GRR to isolate retained revenue before expansion
GRR = (starting recurring revenue − contraction revenue − churned revenue) ÷ starting recurring revenue × 100.
Gross revenue retention (GRR) excludes expansion. In the same example, GRR is ($100 − $3 − $5) ÷ $100 × 100, or 92%. NRR answers whether expansion offset contraction and churn; GRR shows how much opening revenue remained without that expansion. Review both so strong upsell performance does not hide losses in the retained base.
Build net revenue retention as a managed system
Give one leader permanent ownership
Name a leader who is accountable for NRR outcomes, not only for reporting the metric. That owner defines the cohort and calculation policy, sets goals, agrees on the measures used by the team, and keeps the operating approach current as conditions change. Standing reviews and quarterly improvement goals prevent retention work from fading after an initial launch.
Document the decisions behind the number
Write down the reporting period, whether the calculation uses monthly or annual recurring revenue, the opening customer cohort, and the treatment of expansion, downgrades, and churn. Use the same rules from period to period. A calculation that changes its treatment of those components cannot provide a reliable trend, even when the formula itself is correct.
Connect data to the operating process
Data should move between the systems that record customer, commercial, engagement, and renewal activity so leaders have a current view of the portfolio. Technology should reduce friction and repeated manual updates, while the documented definition remains the control. For relevant product context, explore Revspire Customer Intelligence.
Diagnose expansion, contraction, and churn separately
Expansion
Expansion is additional recurring revenue from the opening cohort, such as an upgrade or cross-sell. Track it separately from new-customer revenue. Review which customer segments expanded, which offer or use case changed, and whether the increase persisted into the next period.
Contraction
Contraction is recurring revenue lost when an existing customer remains but moves to a lower level. Separate contraction from full churn so the team can distinguish a reduced commitment from a departed account. Review the account, segment, timing, and reason behind each material downgrade rather than treating all lost recurring revenue as one category.
Churn
Churned revenue is the recurring revenue removed when a customer in the opening cohort leaves. A structured loss review should record what happened and feed the finding into the playbook, training, and strategy. The goal is not to force one explanation onto every loss; it is to preserve evidence that can reveal a repeatable pattern.
Audit the current retention process
Establish an evidence-based baseline
Review the last six months of account and deal data. Map where customers expanded, contracted, renewed, or churned, then break the result down by representative, segment, product, and deal size where those dimensions are available. Compare the data with the narrative used in retention and forecast meetings. Differences between them are questions to investigate, not reasons to discard either source of information.
Define the operating model
For each material retention event, document what action should happen, at what stage, and who is accountable. Add clear milestones, criteria, and shared language so customer success, sales, finance, and revenue operations apply the same definitions. Keep the model simple enough to use and specific enough that a reviewer can identify whether an expected action occurred.
Choose a focused improvement cycle
Select two or three changes tied to the clearest evidence. Give each change an owner and measurable goal, then set a 90-day review. A focused cycle makes it possible to compare the intended change with the observed result before expanding it across the entire process.
Connect the retention bridge to operating evidence
Reconcile the revenue bridge
For every reporting period, reconcile starting recurring revenue to expansion, contraction, churn, and ending recurring revenue for the same cohort. Investigate unexplained differences before publishing NRR or GRR. Retain the component values with the reported percentage so another reviewer can reproduce the calculation.
Pair leading and lagging indicators
NRR and GRR are outcome measures. Earlier signals can direct attention before the period closes. The operating guidance identifies stakeholder engagement, content consumption, mutual action plan progress, deal velocity, stage conversion, time in stage, and buyer engagement quality as possible signals. Choose only the measures that connect to the documented retention process, and review them alongside the revenue bridge.
Measure progress rather than activity
Email, call, and task counts can rise while an account remains at risk. Use observable movement, engagement quality, stakeholder coverage, and the recorded expansion, contraction, or churn event to guide the review. When the evidence and the account narrative disagree, investigate the discrepancy.
Use a weekly cadence and quarterly learning loop
Review live accounts and next actions
Make retention health part of the weekly operating rhythm. Use the review to decide what needs to change during the next seven days, assign responsibility, and return to the evidence at the following meeting. Coach with live accounts so managers can test whether the documented milestones and signals are useful in real work.
Feed outcomes back into the playbook
Use post-deal interviews, CRM analysis, and structured win-loss reviews to capture what worked and what did not. Update playbooks, training, and strategy when the evidence supports a change. Review NRR, GRR, and their component movements against goals each quarter, and include buyer feedback in the decision.
Start the next cycle with a reproducible baseline
Preserve the cohort definition, calculation policy, component values, and review notes. That record lets the next cycle begin from the same definitions and makes changes in expansion, contraction, and churn explainable rather than anecdotal.
Request a Revspire demo to explore how connected customer and deal evidence can support this retention operating rhythm.