Revspire blog
The Complete 2026 Guide to Time-to-Close Benchmarks for Revenue Leaders
Audit and improve B2B time-to-close benchmarks with deal data, stage metrics, clear ownership, weekly coaching, and structured reviews.
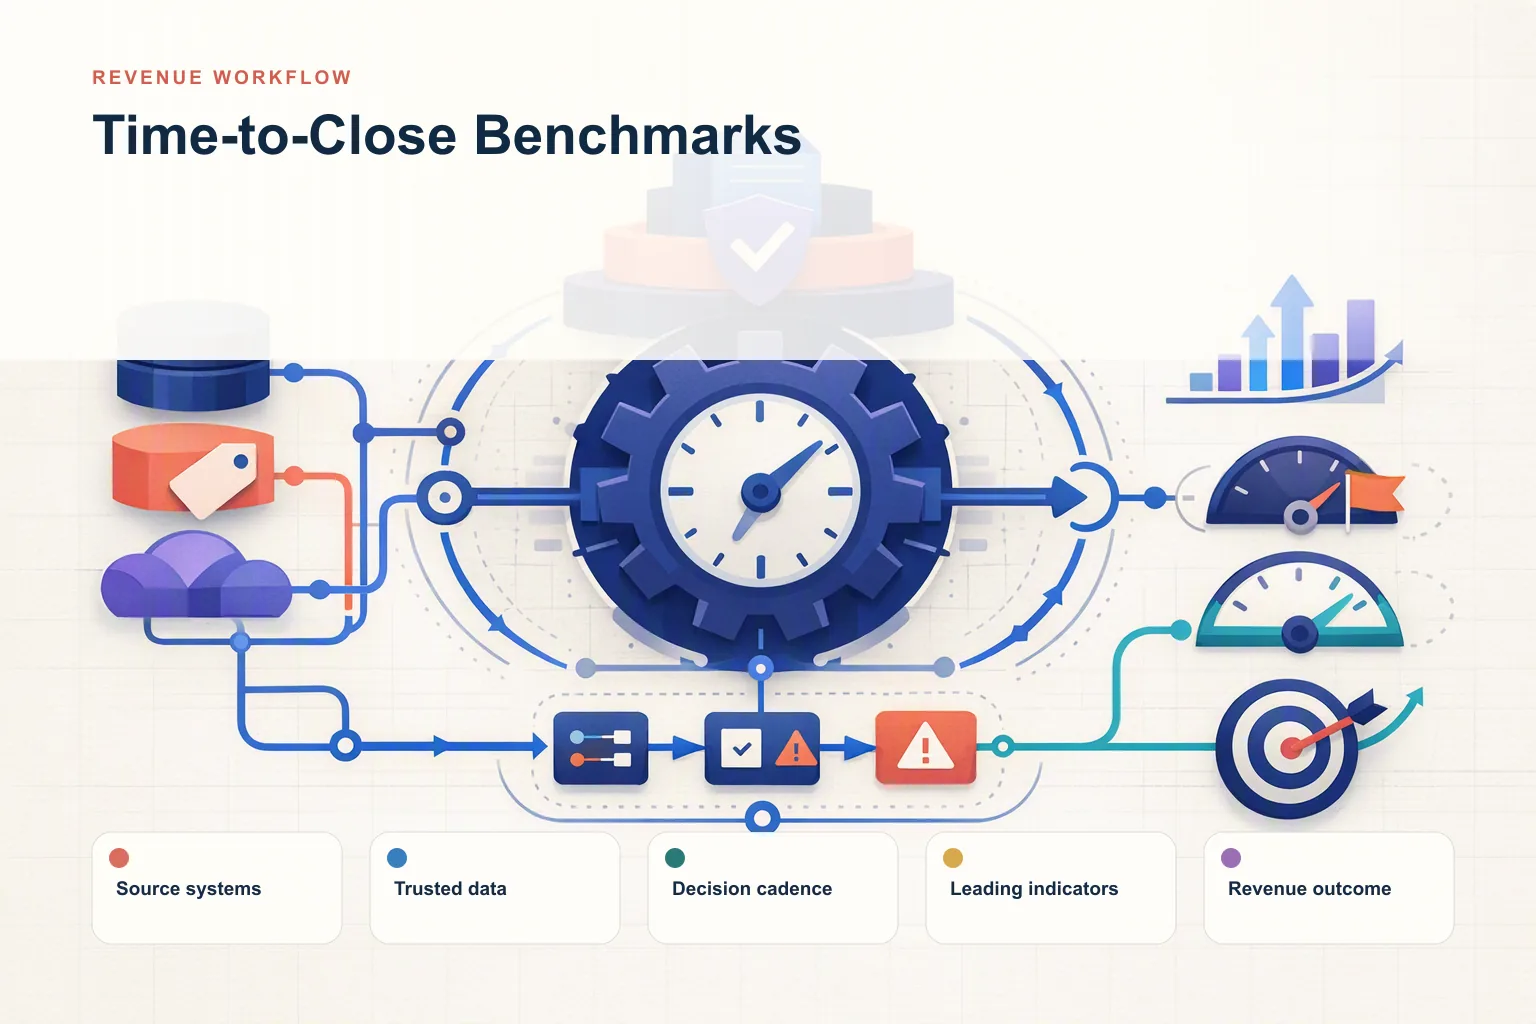
Time-to-close benchmarking should be an ongoing, data-driven discipline rather than a one-time initiative. This guide brings together the supplied framework for auditing current performance, establishing ownership, measuring leading and lagging indicators, coaching live opportunities, learning from wins and losses, and correcting common execution mistakes.
Audit your current time-to-close performance
Before you can improve Time-to-Close Benchmarks, you need an honest baseline. Pull the last six months of deal data. Map every opportunity against the stages and identify where deals are falling out and why. Be specific about which representatives, segments, and deal sizes are affected.
Use the audit to identify where Time-to-Close Benchmarks is working well, where it is breaking down, and what the data says versus what the narrative says. Then prioritize two or three specific improvements with a clear owner and measurable goal.
Build the operating model
An operating model for Time-to-Close Benchmarks answers three questions: what actions should happen, at what stage, and who is accountable. Document the model explicitly. Define what excellent execution looks like at each stage of the deal so the team has a shared standard for coaching, measurement, and improvement.
Assign a permanent owner to Time-to-Close Benchmarks outcomes. Build the work into the operating cadence with standing review meetings, defined metrics, and quarterly improvement goals.
Three-part explainer: Define the system, Operationalize the workflow, and Measure the impact.
Measure what matters
The metrics for Time-to-Close Benchmarks should connect directly to revenue outcomes. Focus on conversion rates at each stage, time-in-stage benchmarks, and the relationship between specific behaviors and win rates.
Lagging metrics such as win rate and quota attainment tell you what happened. Leading indicators—the behaviors that predict those outcomes—tell you what is about to happen. Potential leading indicators include stakeholder engagement, content consumption, mutual action plan progression, and deal velocity at each stage. Lagging indicators include win rates, cycle times, and average deal sizes.
Build a dashboard that shows leading and lagging indicators, review it weekly, and tie it to coaching conversations and territory reviews.
Turn benchmarking into a weekly discipline
Review benchmark health
Build a standing review of Time-to-Close Benchmarks health into the weekly pipeline rhythm. Use it as a structured conversation about what needs to change in the next seven days, not as a status update.
Coach live opportunities
Use deal-specific coaching by reviewing live opportunities with each representative, identifying where execution breaks down, and working through the correction in real time.
Capture win-loss intelligence
Every won and lost deal contains insights about what works and what does not in your approach to Time-to-Close Benchmarks. Capture those insights through post-deal interviews, CRM data analysis, and structured win-loss reviews, then feed them back into playbooks, training, and strategy.
Align technology with the process
Technology should serve the Time-to-Close Benchmarks process, not define it. Evaluate whether each tool makes the process easier and more consistent or adds friction. Additional platform information is available from Revspire Revenue Analytics.
Three-part explainer: Set the standard, Embed the practice, and Scale what works.
Examine where revenue leakage occurs
The source framework identifies three places to examine: early-stage deals that should not enter the pipeline, qualified deals that stall in the middle of the cycle, and late-stage deals lost to process failures such as procurement surprises, unstated objections, or last-minute stakeholder concerns.
When evaluating the business case, also examine the buying experience. In markets where a product is differentiated but not unique, the source material describes an experience that builds trust, reduces perceived risk, and makes competitive displacement harder. It also presents talent as a dimension to assess, including whether representatives develop faster and stay longer.
Three-part explainer: Expose the hidden cost, Build the business case, and Start where it matters.
Correct common time-to-close mistakes
Do not treat benchmarking as a one-time initiative
Maintain permanent ownership, standing review meetings, defined metrics, and quarterly improvement goals.
Check intuition against data
When the data disagrees with intuition, trust the data first and investigate the discrepancy.
Do not single-thread the relationship
Map every stakeholder in the buying committee, assign coverage, and track engagement with each one. Flag deals where only one contact is active as high-risk.
Distinguish activity from progress
Measure outcomes, not activities. Track stage progression velocity, buyer engagement quality, and stakeholder coverage breadth. When activities are high but outcomes are poor, investigate what is happening inside the deal instead of asking for more activity.
Learn from significant losses
After a significant lost deal, conduct a structured review with the representative, analyze the specific breakdowns that contributed to the loss, document the findings, and update the playbook accordingly.
Create a feedback loop
Review Time-to-Close Benchmarks metrics quarterly against targets, update playbooks when you learn something new, solicit feedback from buyers about their experience, and keep asking what change would most improve outcomes.